
Температура водуха (макс, мин)
Air temperature (max, min)

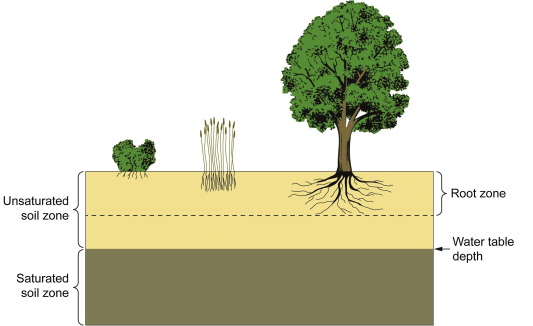
Влажность в корневой зоне и поверхностного слоя грунта (%)
Humidity in the root zone and the surface layer of the soil (%)
Осадки (мм)
Precipitation (mm)
In meteorology, precipitation is any product of the condensation of atmospheric water vapor that falls under gravity from clouds
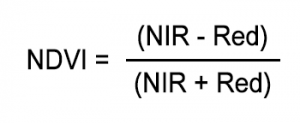
Индекс NDVI
NDVI Index
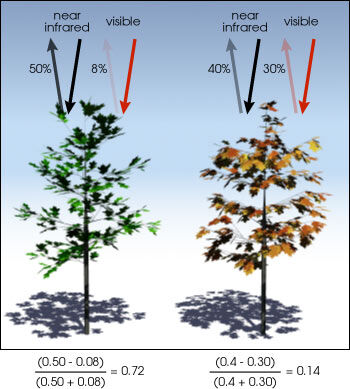
Normalized Difference Vegetation Index (NDVI) quantifies vegetation by measuring the difference between near-infrared (which vegetation strongly reflects) and red light (which vegetation absorbs).
NDVI always ranges from -1 to +1.
Example of NDVI in agriculture
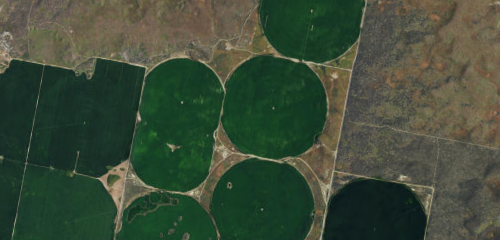
Let’s examine NDVI for an agricultural area with center pivot irrigation. Pivot irrigation rotates on a point creating a circular crop pattern.
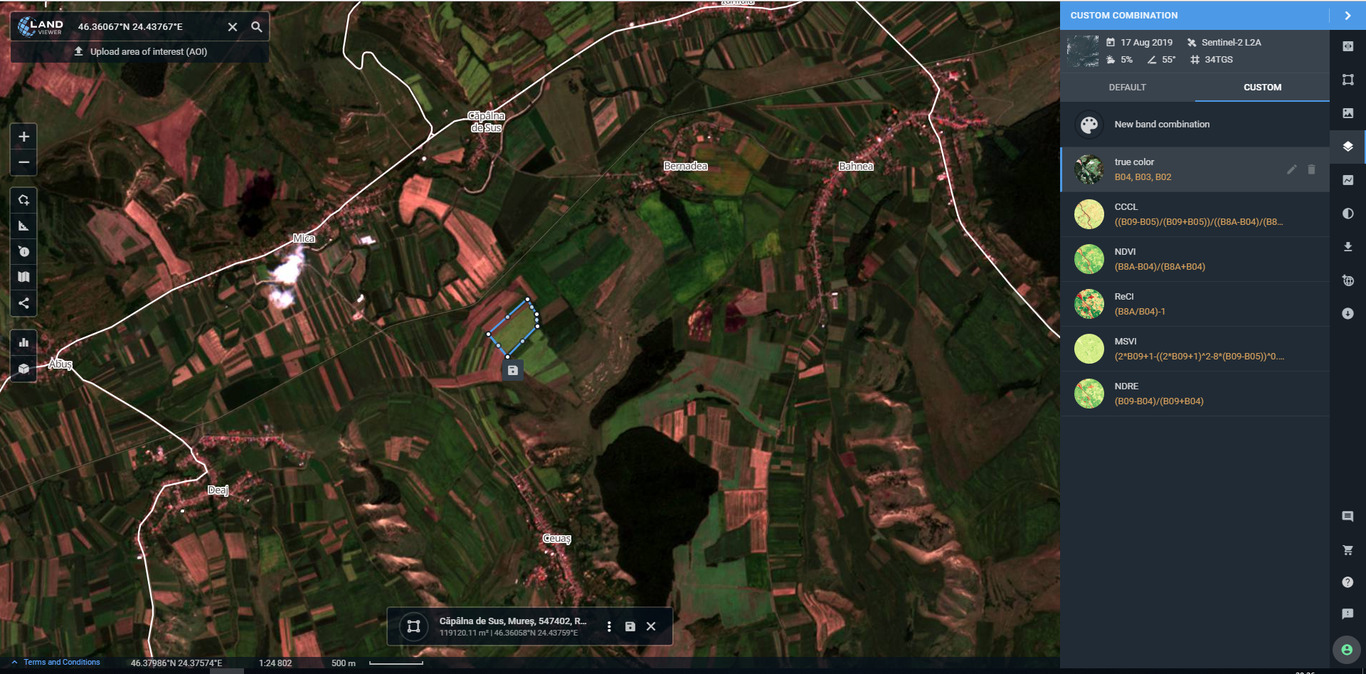
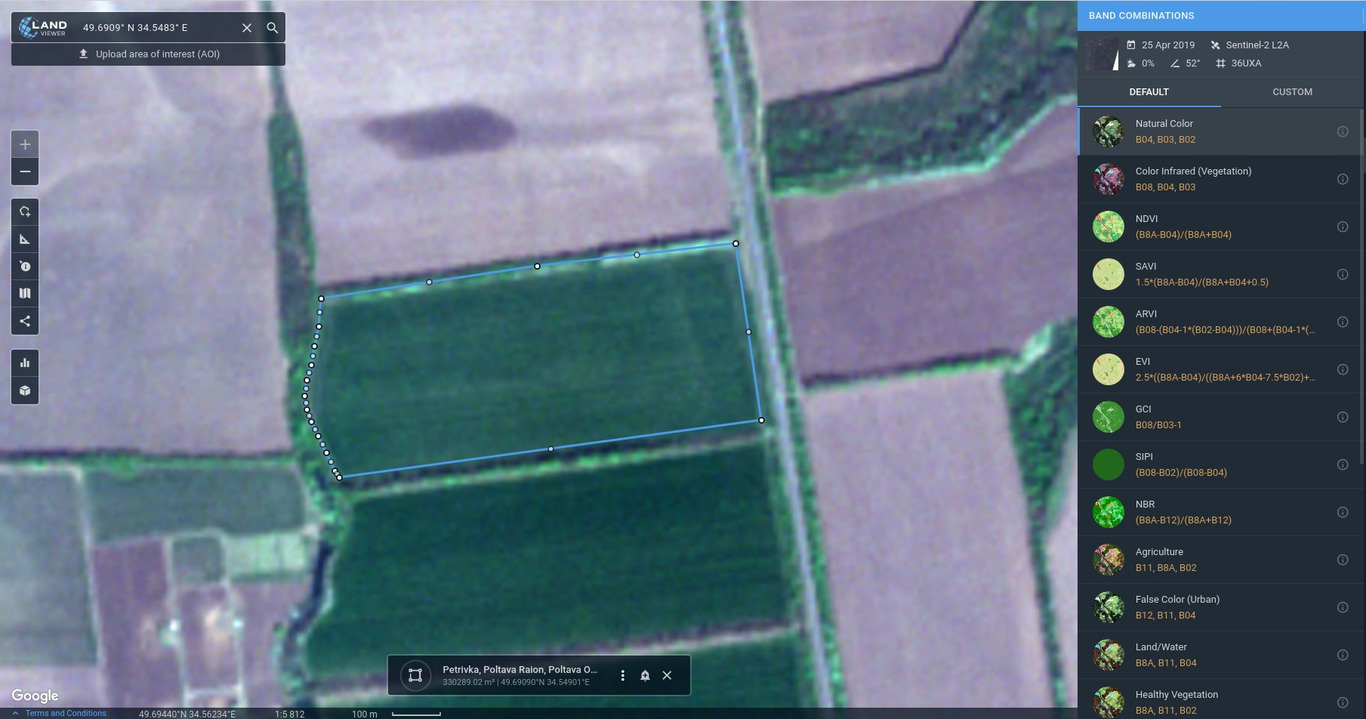
In true color, here’s how it looks for red, green, and blue bands. We say true color because it is the same as how our eyes see.
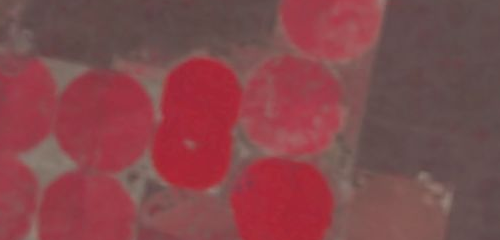
In the formula, you can see how NDVI leverages near-infrared (NIR). So when we put the NIR band to display as red, we get color infrared. We say color infrared because near-infrared is in the red channel. As you can see below, the pivot irrigation vegetation should already be shouting out at you in bright red!
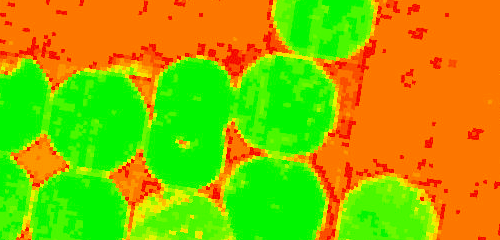
When you apply the formula, bright green indicates high NDVI. Whereas red has low NDVI. So it’s quantifying vegetation by measuring the difference between near-infrared (which vegetation strongly reflects) and red light (which vegetation absorbs).
We see several sectors using NDVI. For example, in agriculture, farmers use NDVI for precision farming and to measure biomass.
Whereas, in forestry, foresters use NDVI to quantify forest supply and leaf area index.
Furthermore, NASA states that NDVI is a good indicator of drought. When water limits vegetation growth, it has a lower relative NDVI and density of vegetation.
In reality, there are hundreds of applications where NDVI and other remote sensing applications is being applied to in the real world.
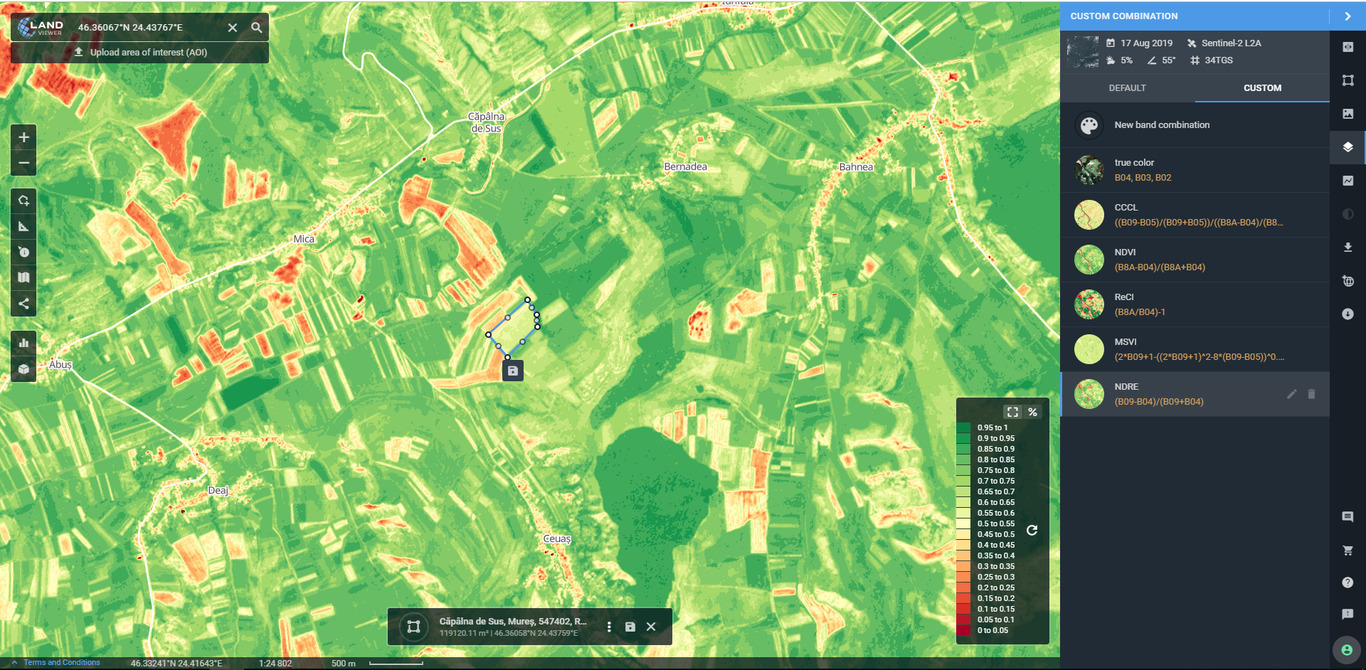
Индекс NDRE - оценка концентраций азота в листьях растений
NDVI index-estimation of nitrogen concentrations in plant leaves
Normalized Difference Red Edge Index
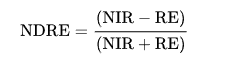
NDRE is a spectral index that is built as a blend of several bands: Nea-InfraRed (NIR) spectrum and a band that uses a narrow spectral range between visible Red and NIR. The index is very similar to the more common and powerful analog with a greater history – NDVI. However, NDRE is more sensitive than NDVI for a certain period of crop maturation. NDRE is a better marker of plant conditions than NDVI for middle and late season crops that have already accumulated a large amount of chlorophyll. The reason is that red-edge light (the one used in NDRE) can pass through the leaves far deeper than red light (the one used in NDVI). It’s more relevant than NDVI for intensive use during the entire cultivation season, as NDVI often becomes inaccurate after plants accumulate a maximum amount of chlorophyll content.
How can NDRE be used and interpreted?
NDRE can be used as a single monitoring point, as well as in combination with NDVI over the entire canopy aging period from the date of seeding to harvest. The index gives a full picture of chlorophyll content which is one of the main Nitrogen indicators and helps with fertilizer application mapping. While analyzing NDRE images, the color palette is typically red to green, where red is bare soil, pale yellow to pale green are unhealthy plants or vegetation that is early in its maturation, and lastly, green is a healthy canopy. Let’s consider the sample data below:
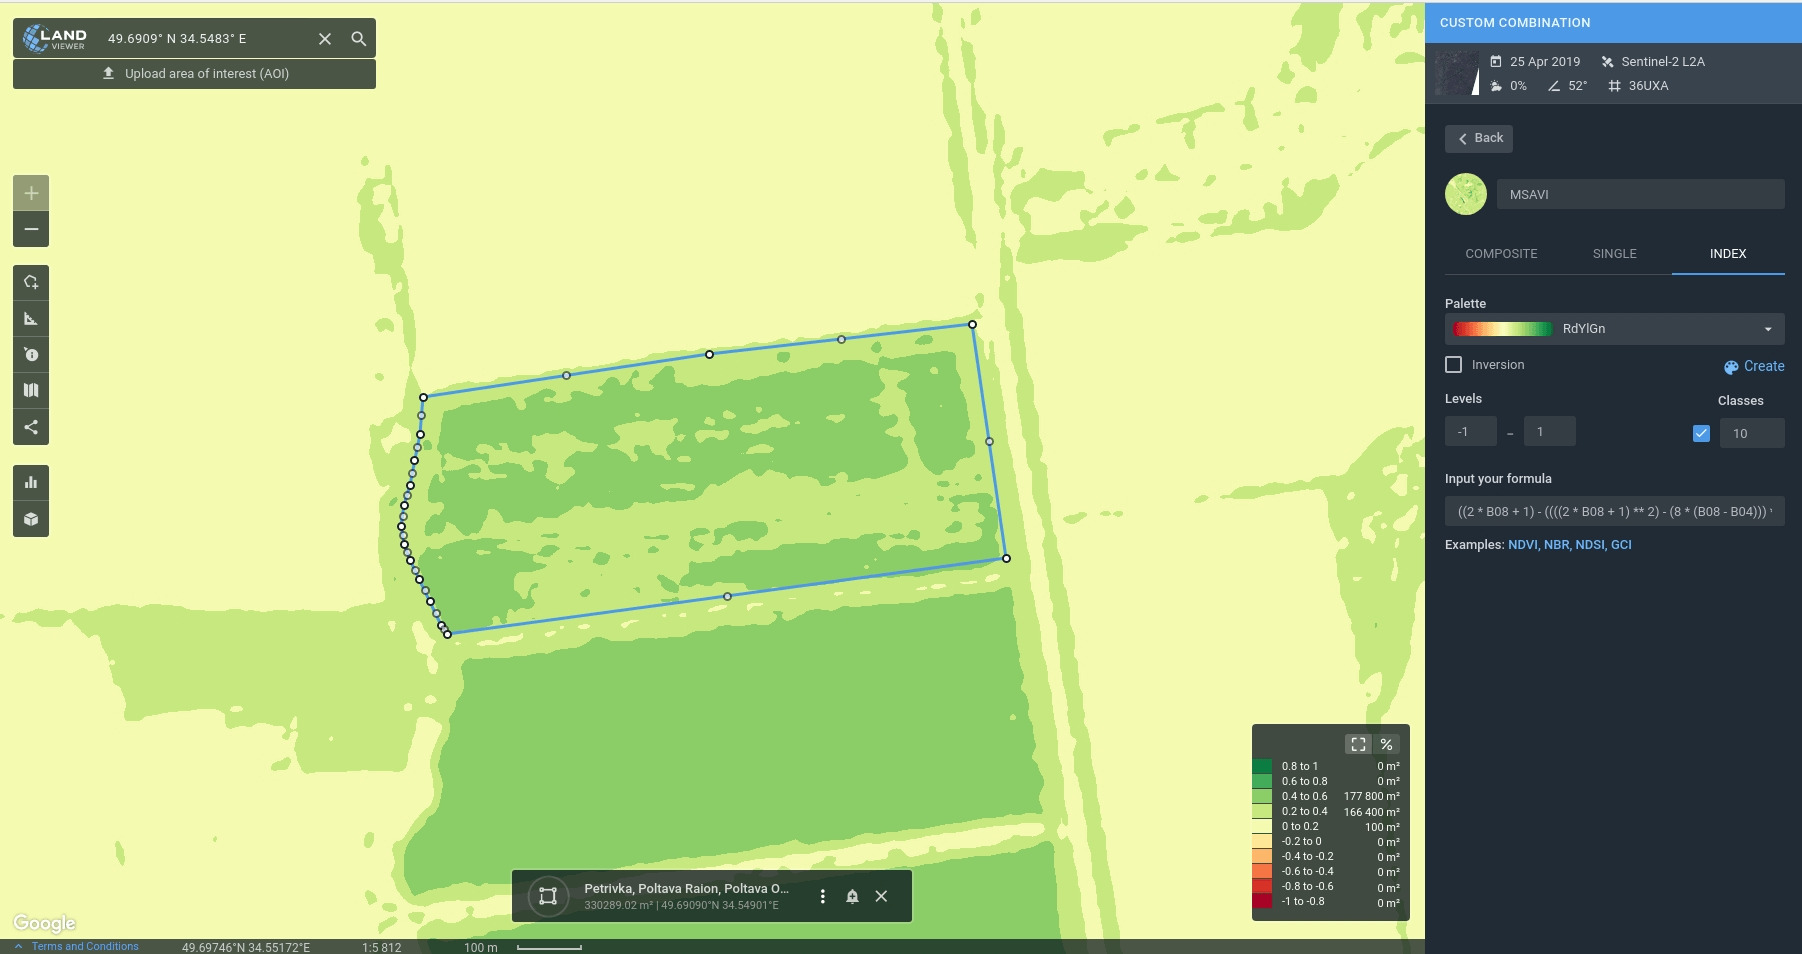
Индекс MSAVI - минимизирование влияние обнаженной почвы
Minimizing the impact of exposed soil
MODIFIED SOIL-ADJUSTED VEGETATION INDEX
The modified soil-adjusted vegetation index (MSAVI) is a vegetation index, which is used to lift limits on applying NDVI to the areas with a high composition of bare soil. MSAVI is used in the areas where indices like NDVI or NDRE provide invalid data, mostly due to a small amount of vegetation, or due to a lack of chlorophyll therein. Thus, the index is used to minimize the soil background influence and to increase the dynamic range of vegetation signal.
How is MSAVI used?
In the fields where plants have just been sown, other indices would fail to obtain accurate data and, as a result, would mislead the farmer; there may be no possibility of proper field treatment. MSAVI, in turn, allows for the monitoring of crop conditions at their earliest developmental stages, as it is specifically designed for this purpose. Thus, the farmer has some early opportunities to apply fertilizers only where and when it is required. This approach allows for optimizing initial field management from the ground up, resulting in the enhancement of profit and the reduction of environmental impact. To understand how this index works, let’s consider the sample data below:
Индекс ReCl - оценка содержания хлорофилла в листьях растений
RECL – CHECK YOUR CHLOROPHYLL LEVELS
Re – stands for Red edge, Cl – for chlorophyll. This index has been designed to detect the chlorophyll content and is most relevant during the active stages of growth. It is measured differently from NDVI, NDRE, and MSAVI, using a scale of all natural numbers starting from 0.
Прогноз погоды на 14 дней
14 days weather forecast